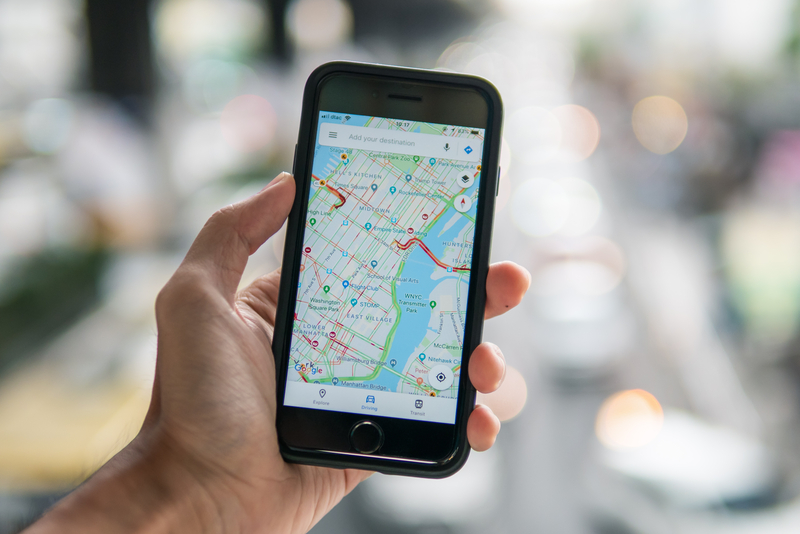
The real-time tracking feature of Google Maps lets public transit users compare options for reaching their destination from their current location in space. Credit: Wachiwit|Dreamstime.com.
The U.S. is one of the most car-dependent countries in the world. About 90% of Americans use their car daily for commutes, errands and leisure trips, and 60% of households have at least two cars. Reasons include the country’s geography, a culture of individualism and historical investment priorities for federal and state highway systems over public transit infrastructure.
That said, some forms of public transit exist in nearly all major U.S. cities—but their actual usage may also depend on the complexity of making travel decisions.
“When I lived in Chicago, I took subways and buses all the time, but existing smartphone apps made it difficult to find the fastest way of getting from A to B,” says AAE assistant professor Rhiannon Jerch. “When Google Maps became available, it was much easier to compare transit options and travel times from my current location to my destination. Since this made a big difference in my daily life, I was curious if the rollout of Google Maps changed transit ridership across the country.”
To answer that question, Jerch teamed up with two other economists and focused on 128 U.S. transit systems in 87 cities: the largest systems by annual revenue and ridership that captured 92% of all recorded public transit trips. An undergraduate researcher helped manually assemble rollout dates of the Google Maps real-time tracking feature from 2011 to 2019 by reviewing online press releases, blogs and social media posts.
Next, the team combined the rollout dates with ridership numbers for four modes of transportation: bus, subway, commuter rail and light rail. The goal was to compare per-capita ridership in 44 transit systems before and after the rollout and 84 “control” systems not yet included by December 2019. The researchers accounted for many other factors that influenced transit usage from 2002 to 2019: service density and frequency, Uber availability, socioeconomic status and other demographic variables.
Three years after the Google Maps rollout, per-capita ridership had increased by 14%, equivalent to almost 1.5 extra transit trips per capita, per month. The effect of this digital intervention was similar in magnitude to large-scale infrastructure expansions, such as the construction of new light rail or subway lines. Above-median income households had substantially more ridership growth.
The researchers found only limited effects of proprietary apps developed by specific transit authorities. Thus, they attributed the observed benefits to the ubiquity and customized navigation directions of Google Maps. An analysis of transit fares showed that users were willing to pay between $0.73 and $1.30 per trip for real-time tracking data. This was equivalent to reducing average travel times by 2 to 15 minutes, based on published value-of-time estimates.
The team developed a measure of information complexity since highly networked transit systems in large metropolitan areas, such as New York City and Chicago, are more difficult to navigate than those in smaller cities. Indeed, the rollout of Google Maps had the largest impact in highly complex transit systems, with subways experiencing greater ridership increases than buses.
The researchers also analyzed American Community Survey data about the primary commuting method of more than 1.2 million people. Self-reported survey information was available for an overlapping period (2008-2015) in a subset of 74 cities with populations above 250,000.
“This independent analysis generated a mirror image of changes over time in how people traveled to work,” says Jerch. “Thus, Google Maps likely helped commuters substitute away from car trips toward public transit.”
Last but not least, data from the U.S. Environmental Protection Agency provided suggestive evidence that the greater transit usage improved urban air quality. An estimated 75% of urban carbon monoxide (CO) is produced by moving vehicles. This is higher than in other countries, partially because U.S. transit usage ranks among the lowest in the developed world. Estimated annual costs for the impact of congestion on public health and human productivity exceed $30 billion.
Analyzing daily CO measurements from 2008 to 2019, the team found that CO levels fell by 6% for the average city resident three years after the availability of real-time transit tracking data. This was a greater reduction than expected from changes in commuter trips alone, says Jerch, suggesting that more frequent transit usage extended to errands and leisure trips.
“Taking one car off the road in cities with regular stop-and-go traffic provides much greater air quality improvements, compared to a car traveling 65 mph on the highway,” explains Jerch. An influx of visitors for major events—concerts, sports matches and Olympic Games—tends to increase this stop-and-go traffic. Thus, adds Jerch, it would be interesting to test if the availability of Google Maps for robust and reliable transit systems helps reduce event-related urban pollution.
The study’s policy implications are nuanced. Many low-income U.S. residents don’t have the luxury of choosing between cars and subways. Instead, they rely heavily on buses, and cost is an important policy tool. Offering public transit free of charge in Estonia, for example, modestly increased ridership; large government subsidies led to short-term increases of 35-50% in Germany.
While continued efforts to increase service densities and frequencies are also warranted, the new study is among the first to identify the cognitive complexity of travel decisions as an underappreciated determinant of public transit usage.
“Reducing that cognitive barrier with easily accessible and personalized information increased ridership, even in a very car-dependent society, and offered not only time savings but also measurable environmental benefits,” says Jerch. “This illustrates the potential of low-cost technology to reshape urban mobility.”