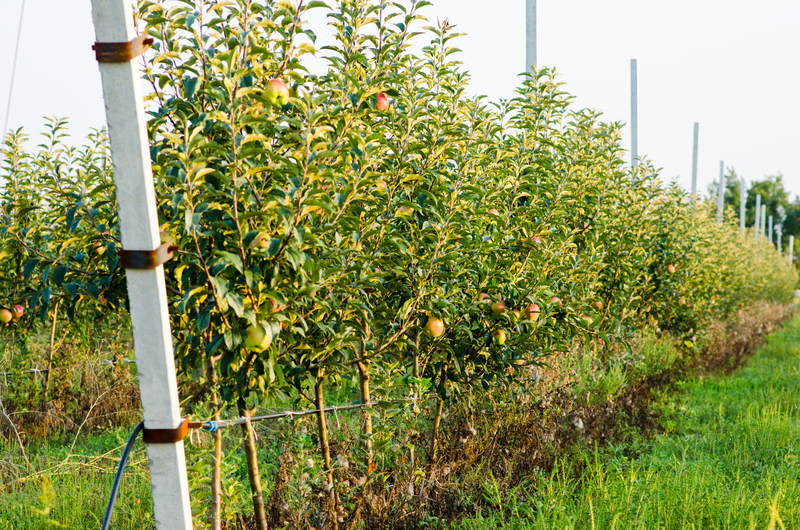
Irrigation needs for apples vary by region and season. A detailed national database documenting where and when farmers grow which fruits and vegetables can help conserve water and other natural resources used in our food system. Credit: Irina Laur|Dreamstime.com.
The internet contains a treasure trove of datasets that researchers can analyze—some of enormous size. But their quality and accuracy vary widely. That matters since conclusions drawn from statistical analyses are only as credible as the data they are based on.
AAE faculty associate Jing Yi has first-hand experience with the impact of data quality on agricultural food systems research, her main area of interest. In collaboration with economists at the U.S. Department of Agriculture and Cornell University, Yi’s long-term goal is to understand how natural resources—forest products, fossil fuels, agricultural land and water withdrawals—are used throughout the U.S. food system, all the way from farm to fork.
“Six years ago, we wanted to determine how much of each natural resource is used by specific crops,” says Yi. “But many data points were missing and detailed space-and-time information was not available for the entire country.”
The researchers noticed, for example, that annual production data for strawberries were only available for California and Florida. All other states were included in national totals but lacked state- and county-specific information. That’s why the team decided to develop a national database of monthly, county-level production statistics for 34 perishable fruits and vegetables as an important step toward their goal of understanding farm-to-fork natural resource use.
The main reasons for missing agricultural production data are suppression requirements and resource constraints. Data suppression means the USDA cannot release data provided by a small number of survey respondents—say apple counts from fewer than three farmers—for confidentiality reasons. Counts are also suppressed when one farmer accounts for more than 60% of total production. Protecting data privacy is important, but excluding all suppressed information from statistical analyses may generate misleading conclusions. Since data collection is time-consuming and costly, missing information may also be due to limited state or federal budgets.
The researchers proposed a solution to the data suppression problem in a recently published paper. That work helped them develop a strategy for addressing the second, more complex problem: the spatial and temporal decomposition of data by combining multiple sources of information. In a nutshell, the data imputation method builds recipes, or algorithms, for estimating the statistically most likely value for a county’s missing monthly strawberry counts given all existing information about the larger entities the missing element belongs to. That can be the year (sum of all months), the state (sum of all counties) or the country (sum of all states).
Such recipes—known as machine learning algorithms—are common in climate research, says Yi, but not yet widely known in the agricultural food systems world, where data are typically collected with surveys mailed to farmers every one to five years. “Developing a data imputation method that addresses the complexity of agricultural surveys is critical for obtaining high-quality datasets for analyses of interest,” notes Yi.

The team’s data imputation strategy includes three steps. First, several databases with production data for perishable produce are combined with a yearly import/export database. The Census of Horticulture, for example, includes cucumbers, tomatoes, lettuce, peppers and other vegetables grown in hydroponic greenhouse systems; the Census of Agriculture includes fruits and vegetables grown in open fields. Total domestic produce availability is determined by adding imports and subtracting exports.
Second, the yearly national counts are spatially allocated to states and counties by estimating the most likely value for (i) a state’s missing count given national data and (ii) a county’s missing count given state-level data. The third step is the allocation of yearly to monthly data following similar principles. The final result is an imputed county-level U.S. database with monthly counts for 34 fruits and vegetables.
Compared to excluding missing data and being limited to national or state-level analyses, the imputed data will enable a deeper understanding of current agricultural practices. The new database can be used, for example, to estimate changes in the use of natural resources if Americans were to adopt a healthier diet.
“Detailed information about current practices will identify opportunities to reduce water and energy needs and lower greenhouse gas emissions,” says Yi. “Helping researchers, policymakers and industry professionals work toward these goals is part of our broader efforts to make the U.S. agri-food supply chain more resilient and sustainable while meeting the growing demand for food.”